
The comparison between a single-species fruit orchard and a multi-species agroforestry system is one of the most practically relevant questions for managed farmland investors who are choosing between planting models. This FAQ provides a specific, numbers-based ten-year income comparison that allows this decision to be made on financial evidence rather than general principles.
The Comparison Setup
Both systems are on the same two-acre Karnataka agricultural plot with adequate drip irrigation, the same starting soil quality, and the same management quality assumed throughout. The comparison covers a ten-year period from planting.
System A: Single-species mango orchard. One hundred grafted mango trees per acre (two hundred trees total), planted at ten by ten metre spacing. No other crops established.
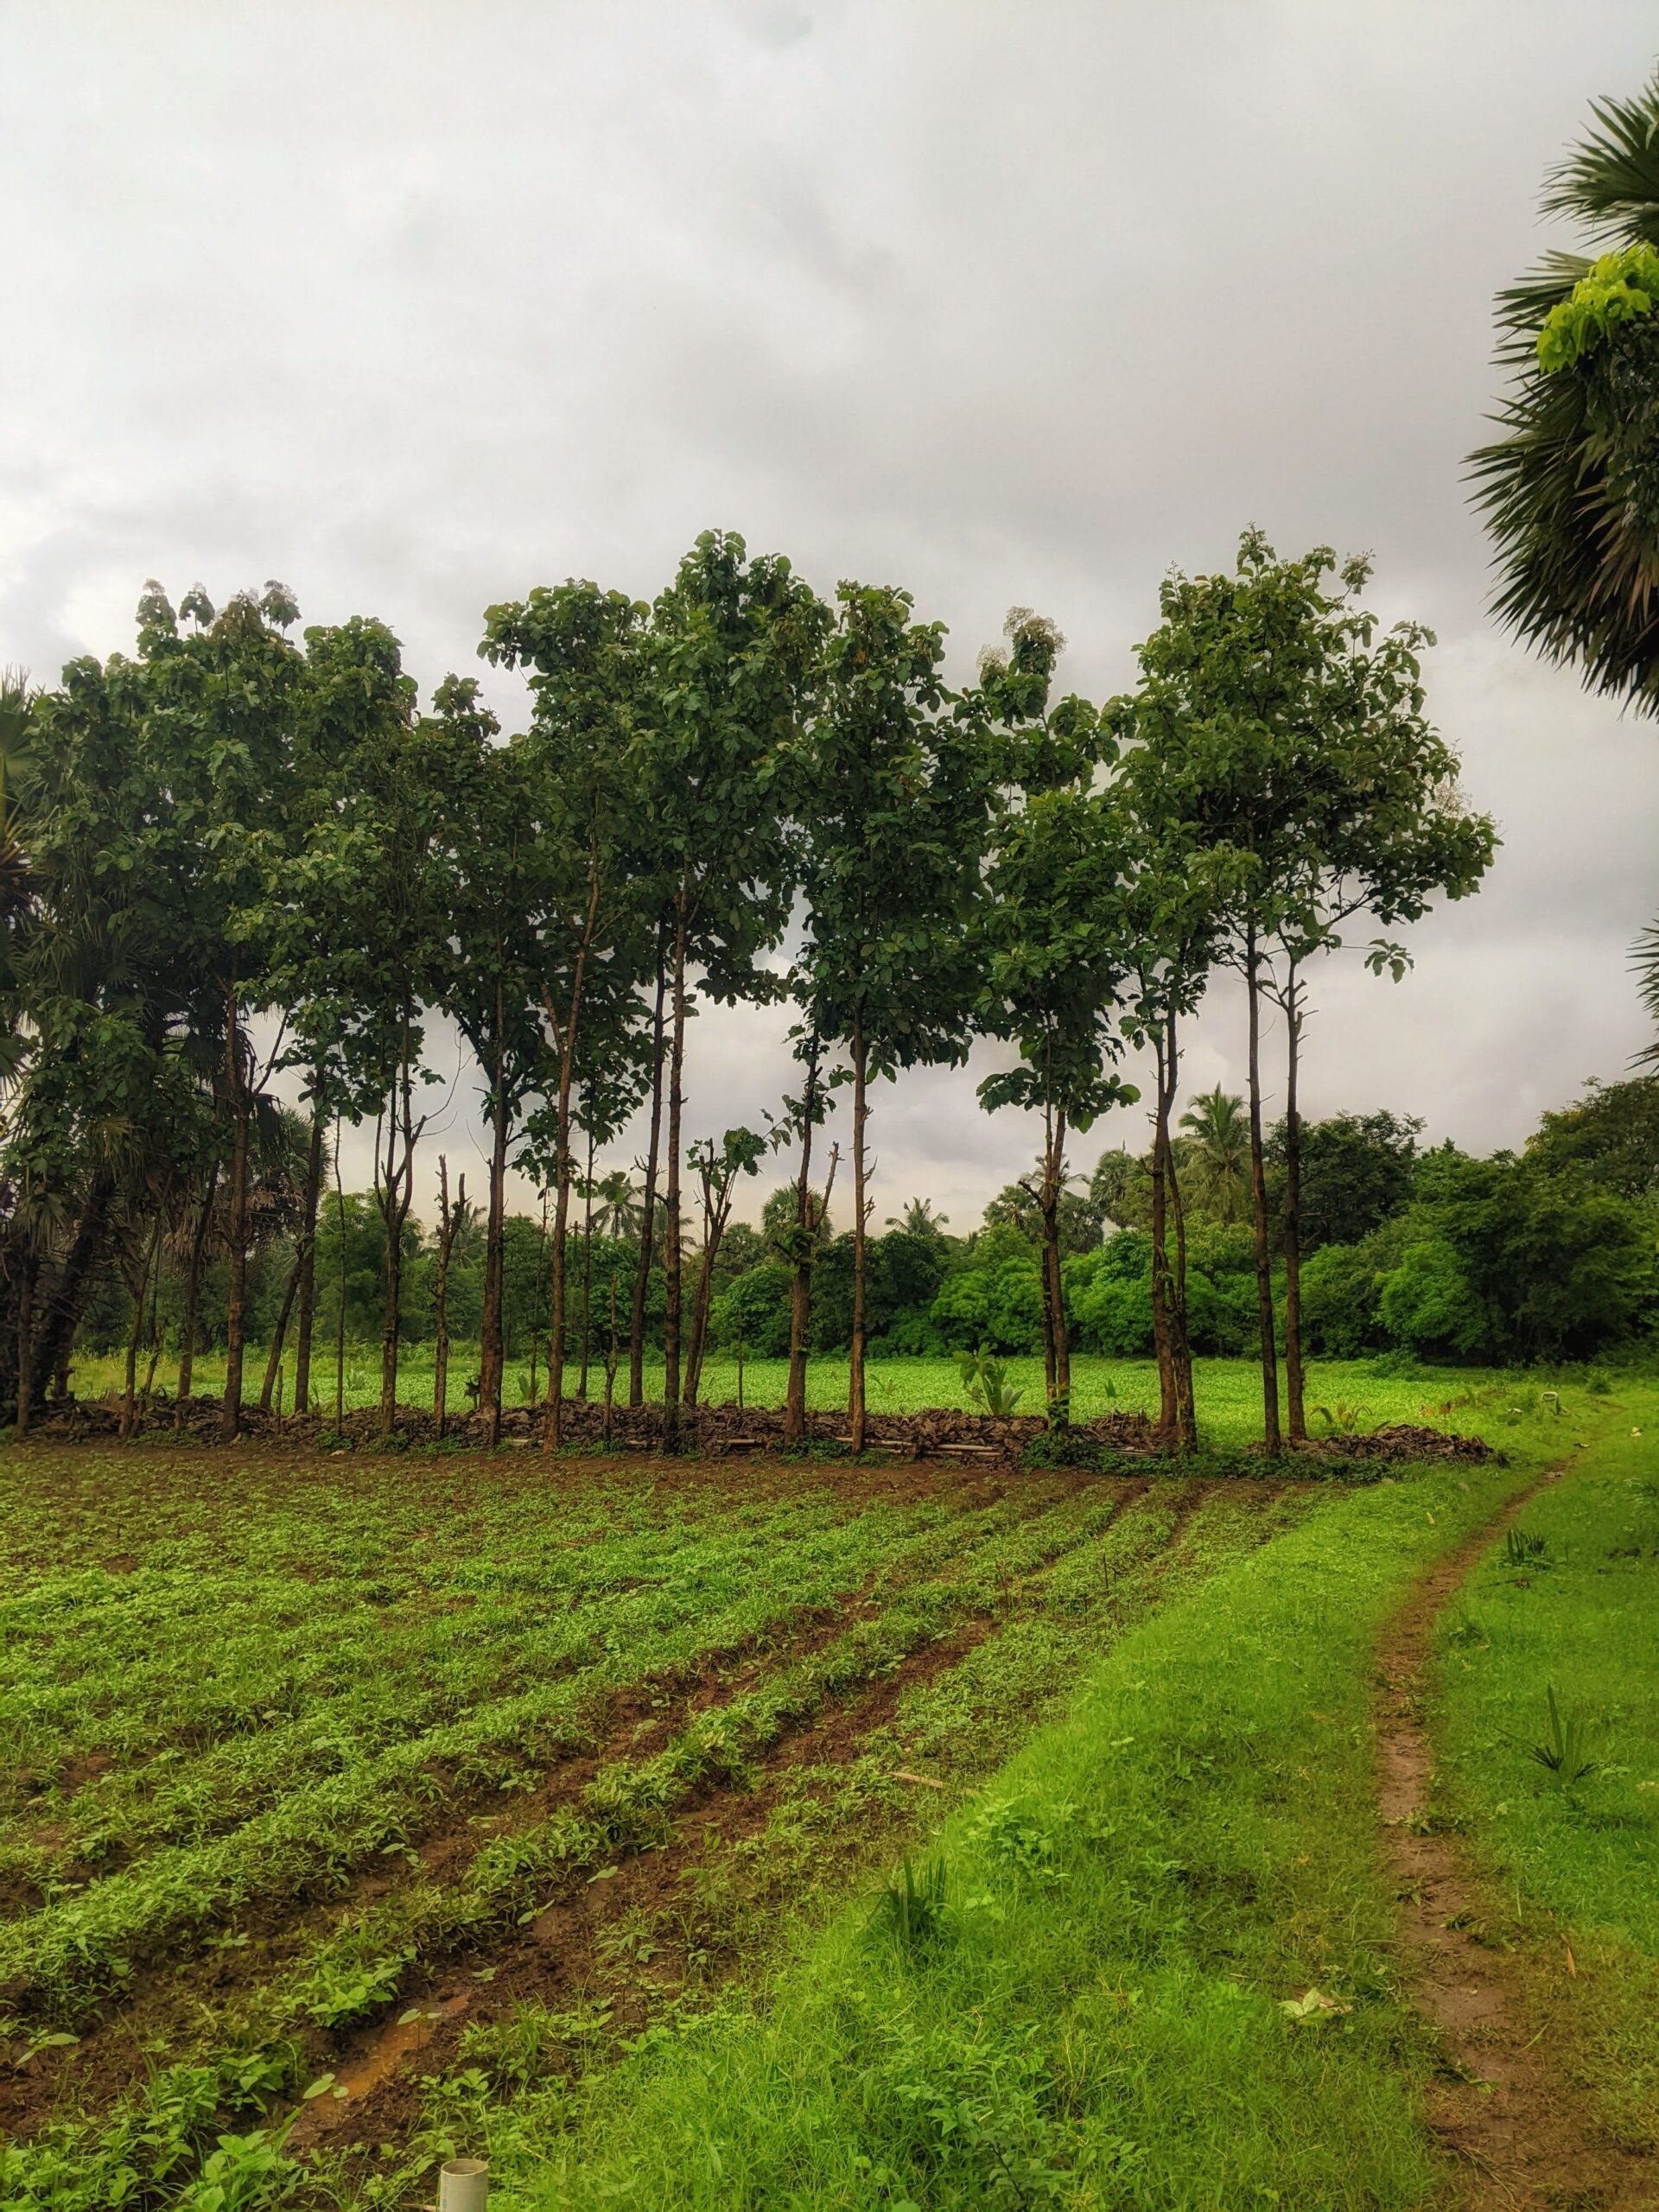
System B: Multi-species agroforestry. Sixty grafted mango trees per acre (one hundred and twenty trees total) as the primary fruit species, plus twenty sapota trees per acre (forty trees), ten guava plants per acre (twenty plants), twenty silver oak canopy trees per acre (forty trees), eight teak trees per acre (sixteen trees), and pineapple as bridge crop across all inter-row spaces in years one to three. Pepper vines on silver oak trees from year two.
Year One to Three Income
System A (mango monoculture): Zero commercial fruit income — mango trees are establishing. The land produces nothing in years one to three. Some management cost but zero crop income return.
System B (multi-species agroforestry): Pineapple bridge crop begins generating income from year one and a half. Two acres of pineapple in the inter-row spaces produces approximately twenty thousand to thirty thousand rupees per year from year one and a half to three. Guava begins bearing from year two — modest commercial quantities generating fifteen thousand to twenty-five thousand rupees per year by year three. Small pepper production beginning year three.
System B years one to three total income: Approximately sixty thousand to eighty-five thousand rupees cumulatively. System A: Zero.
Years Four to Six
System A: Mango begins commercial production from year four to five. By year six, one hundred and twenty trees at commercial yield produce approximately eighty to one hundred and twenty kilograms per tree, generating fifty to eighty rupees per kilogram average. Year six income: approximately nine to nineteen lakhs gross (wide range reflecting variety and channel uncertainty). Guiding conservative estimate: nine lakhs (at one hundred kilograms per tree × two hundred trees × forty-five rupees per kilogram).
System B: One hundred and twenty mango trees at commercial production generate sixty to seventy percent of System A’s mango income (fewer trees) — approximately five and a half to six lakhs. Plus sapota at commercial volumes: forty trees × thirty kilograms × twenty-five rupees = thirty thousand rupees annually. Plus guava at full production: twenty plants × thirty kilograms × twenty rupees = twelve thousand rupees annually. Plus pepper at commercial volumes: forty vines × one kilogram dried × four hundred rupees = sixteen thousand rupees annually. System B year six total: approximately six to six and a half lakhs. System A: nine lakhs.
System A leads on year six annual income — as expected with more mango trees. But System A had zero income in years one to three; System B had sixty to eighty-five thousand cumulative.
Years Seven to Ten
System A: Mango approaching peak. Year ten income from two hundred mature mango trees: conservative estimate twelve to fourteen lakhs.
System B: Mango maturing — year ten income from one hundred and twenty mango trees: eight to nine lakhs. Plus sapota, guava, pepper combined: approximately one and a half lakhs. Silver oak pruning income begins: approximately forty to sixty thousand per year. Total System B year ten: nine and a half to eleven lakhs.
The gap between the two systems narrows significantly as System B’s additional species mature and contribute.
Cumulative Ten-Year Income Comparison
System A total income years one to ten (conservative): Zero (years one to three) + thirty lakhs (years four to ten at a growing curve) = approximately thirty to thirty-five lakhs.
System B total income years one to ten: Eighty-five thousand (bridge crop and early species) + twenty-four lakhs (years four to ten combined multi-species) = approximately twenty-five to twenty-eight lakhs.
The Conclusion — and Why the Comparison Misses Something
At the purely annual income level over ten years, the two systems are relatively comparable — with System A having a slight edge from higher mango tree count and System B having earlier income from the bridge crops and diversification.
But the comparison misses three critical factors that make System B the better investment decision.
First, risk: In System A, a single bad mango year — a pest outbreak, a poor flowering season, a commodity price trough — eliminates all income for that year. In System B, cardamom, pepper, sapota, and guava income continues regardless of the mango year’s outcome.
Second, long-term timber: System B’s silver oak and teak stands accumulate timber value throughout the ten years — unrealised but real. By year ten, the sixteen teak trees and forty silver oak trees have material standing timber value that will generate lump-sum income in years fifteen to twenty. System A has no timber component.
Third, soil health: System B’s multi-species root architecture, canopy diversity, and greater organic matter return from leaf litter continuously improves the soil health that determines both systems’ year eleven to thirty income. System A’s monoculture progressively degrades the soil’s biological balance, increasing input requirements and potentially reducing long-term productivity.
The correct conclusion: over ten years, the systems are comparable in direct income. Over twenty to thirty years, System B is the demonstrably superior investment — for risk resilience, timber value, and soil health compounding that the ten-year comparison cannot fully capture.
Disclaimer: The yield estimates, income figures, and crop price projections presented in this 10-year comparison are hypothetical models based on historical data and generalized growth rates. Actual agricultural returns depend on specific land conditions, local climate, water availability, labor costs, and market fluctuations. Readers should consult with agricultural and financial experts before making managed farmland investments.